Building a web service with Node.js in Visual Studio Part 4: Node.js web service basics

Introduction

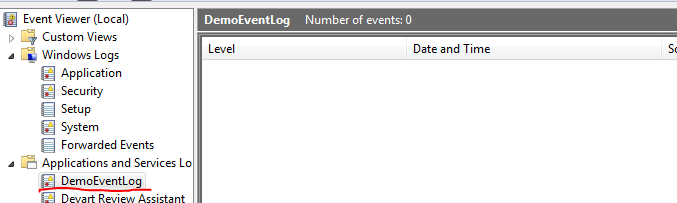
In the previous post we practiced some basic MongoDb queries that will be useful in our project later on. In this post we’ll start looking at the basic structure of a Node.js web service.

The goal of this post is to go through some code basics in Node.js so we’ll take an easy start.

Keep in mind that Node.js supports asynchronous code execution by default. You don’t need to add any special code for that. In .NET we can add support using the await-async pattern but currently the starting point for an MVC.NET project template is synchronous code execution.

A consequence of asynchronous code execution in Node.js is the ubiquity of callbacks. We’ll see callbacks passed into a large number of methods. The presence of callbacks will make sure that the available threads can be put to work and serve requests and methods without delegating all work to a single thread. The end result will be a better utilisation of threads and CPU. We saw similar behaviour in .NET in the post on async-await referenced above.

Selecting the template

We installed the ingredients necessary for building a Node.js project in Visual Studio. Open Visual Studio 2013 Pro and let’s see which template can be useful for us:

Available NodeJs templates in Visual Studio

We can immediately rule out all Azure applications. We don’t have any existing Node.js apps so option #2 can be ruled out too. There are two templates that install the “Express” framework. Recall that Express is a web application framework upon Node, so it’s something like ASP.NET running on IIS. However, those templates implement views and a lot more code that we’d need to discuss. Since we’re building a web service we’d need to start by removing code. I’d like to avoid that. Also, adding new code and providing an explanation is easier at this beginning level than saying “we don’t need that, you can erase it”.

So we have two remaining “blank” applications: a console and a web app. We saw the console app in the first post of this series. We could actually go with that template and build upon it from scratch. However, we’ll take the other template instead so that we have something to start with at least. It won’t install Express.js but we can install it ourselves – it will be a good occasion to take a look at the Node Package Manager tool.

Select the “Blank Node.js Web Application” template, call the project CustomerOrdersApi and press OK.

Starting point

Most elements look familiar from the first part. We have a server.js which is the entry point to the application, similar to Program.cs in a .NET console app. It currently has the following contents:

var http = require('http');
var port = process.env.port || 1337;
http.createServer(function (req, res) {
    res.writeHead(200, { 'Content-Type': 'text/plain' });
    res.end('Hello World\n');
}).listen(port);

Even before going through this code let’s run it. Press F5 as you normally do in Visual Studio. This should open a browser, navigate to http://localhost:1337/ and that will print “Hello World” as plain text on the screen.

Let’s consider the bits of code in server.js which is the entry point of the application, much like Global.asax.cs in an ASP.NET web app:

var http = require('http');

“require” is the node.js equivalent of a using statement in C#. We import the package called “http” which includes the tools for handling HTTP calls. This package is part of the standard node library so we didn’t have to do anything special to import it.

http.createServer(function (req, res)

We use the http library to create a server. The createServer accepts a callback which in turn accepts parameters for the HTTP request – req – and HTTP response – res. The “req” parameter will allow us to access the different parts of an incoming HTTP request: the headers, the query, the URL etc.

.listen(port);

The listen(port) method of the http object will make sure that we’re listening to requests on the given port. The port is assigned from a default value. If that’s null then we go with 1337. Unsurprisingly we’d use port 80 for a public HTTP web server and 443 for HTTPS.

res.writeHead(200, { 'Content-Type': 'text/plain' });
res.end('Hello World\n');

The body of the callback function is very simple. It sets the response code to 200 OK and the content-type header to text/plain. Then we send a string back saying Hello World.

Let’s output some simple HTML instead. Change the callback function as follows:

res.writeHead(200, { 'Content-Type': 'text/html' });
var url = req.url;
res.end("<html><body><p>Requested URL: " + url + "</p></body></html>");

We read the URL of the request and put it in a paragraph. Run the project and you’ll see the following output:

Requested URL: /

Now extend the URL to e.g. http://localhost:1337/hello/bye and the output will be the following:

Requested URL: /hello/bye

Let’s read some other properties of “req”:

var url = req.url;
res.end("<html><body><p>Request properties: URL: " + url + ", method: " + req.method +
        ", http version: " + req.httpVersion + "</p></body></html>");

You’ll probably understand what those properties mean.

We can indicate in the header section that some resource was not found:

res.writeHead(404, { 'Content-Type': 'text/html' });

The 404 will be visible in the developer tools of your browser. Here’s the output in Chrome:

404 returned by Node server

So you can see that we can read a lot of properties of the request and set the response accordingly. We could in theory use this simple template for a web service and handle all the GET, POST etc. requests based on the incoming URL in a gigantic if-else statement. However, that would be a bad idea. We’d like to build request handlers comparable to those in MVC.NET routes and controllers.

That’s where the Express.js library enters the scene. We’ll import it and at the same time discuss the Node Package Manager in the next post.

View all posts related to Node here.

Listing all performance counters on Windows with C# .NET

Performance counters in Windows can help you with finding bottlenecks in your application. There’s a long range of built-in performance counters in Windows which you can view in the Performance Monitor window:

Performance Monitor window

Right-click anywhere on the larger screen to the right and select Add Counters to add your counters to the graph. The Add Counters window will show the categories first. You can then open a category and select one or more specific counters within that category. The graph will show the real-time data immediately:

Performance Monitor with added pre-built categories

The System.Diagnostics namespace has a couple of objects that let you find the available performance categories and counters on the local machine or on another machine. Each performance category has a name, a help text and a type. It’s straightforward to find the categories available on a machine:

PerformanceCounterCategory[] categories = PerformanceCounterCategory.GetCategories();
foreach (PerformanceCounterCategory category in categories)
{
	Console.WriteLine("Category name: {0}", category.CategoryName);
	Console.WriteLine("Category type: {0}", category.CategoryType);
	Console.WriteLine("Category help: {0}", category.CategoryHelp);
}

GetCategories() has an overload where you can specify a computer name if you’d like to view the counters on another computer within the network.

At the time of writing this post I had 161 categories on my machine. Example:

Name: WMI Objects
Help: Number of WMI High Performance provider returned by WMI Adapter
Type: SingleInstance

Once you got hold of a category you can easily list the counters within it. The below code prints the category name, type and help text along with any instance names. If there are separate instances within the category then we need to called the GetCounters method with the instance name if it exists otherwise we’ll get an exception saying that there are multiple instances.

PerformanceCounterCategory[] categories = PerformanceCounterCategory.GetCategories();
foreach (PerformanceCounterCategory category in categories)
{
	Console.WriteLine("Category name: {0}", category.CategoryName);
	Console.WriteLine("Category type: {0}", category.CategoryType);
	Console.WriteLine("Category help: {0}", category.CategoryHelp);
	string[] instances = category.GetInstanceNames();
	if (instances.Any())
	{
		foreach (string instance in instances)
		{
			if (category.InstanceExists(instance))
			{
				PerformanceCounter[] countersOfCategory = category.GetCounters(instance);
				foreach (PerformanceCounter pc in countersOfCategory)
				{
					Console.WriteLine("Category: {0}, instance: {1}, counter: {2}", pc.CategoryName, instance, pc.CounterName);
				}
			}
		}
	}
	else
	{
		PerformanceCounter[] countersOfCategory = category.GetCounters();
		foreach (PerformanceCounter pc in countersOfCategory)
		{
                	Console.WriteLine("Category: {0}, counter: {1}", pc.CategoryName, pc.CounterName);
		}
	}	
}

Each counter in turn has a name, a help text and a type. E.g. here’s a counter with the “Active Server Pages” category:

Name: Requests Failed Total
Help: The total number of requests failed due to errors, authorization failure, and rejections.
Type: NumberOfItems32

You can view all posts related to Diagnostics here.

4 ways to enumerate processes on Windows with C# .NET

A Process object in the System.Diagnostics namespace refers to an operating-system process. This object is the entry point into enumerating the processes currently running on the OS.

This is how you can find the currently active process:

Process current = Process.GetCurrentProcess();
Console.WriteLine(current);

…which will yield the name of the process running this short test code.

It’s probably very rare that you’ll use the above method for anything as it’s not too useful.

You can locate a Process by its ID as follows:

try
{
	Process processById = Process.GetProcessById(7436);
	Console.WriteLine(processById);
}
catch (ArgumentException ae)
{
	Console.WriteLine(ae.Message);
}

I opened the Windows Task Manager and took a process ID from the list. Process ID 7436 at the time of writing this post belonged to Chrome, hence the Console printed “chrome”. The GetProcessById throws an argument exception if there’s no Process with that id: “Process with an Id of 1 is not running”.

There’s an overload of GetProcessById where you can specify the name of the machine in your network where to look for the process.

You can also look for processes by their name:

Process[] chromes = Process.GetProcessesByName("chrome");
foreach (Process process in chromes)
{
	Console.WriteLine("Process name: {0}, ID: {1}", process.ProcessName, process.Id);				
}

I had 4 “chrome” processes running when writing this post with the following ids: 7544, 7436, 6620, 7996. GetProcessesByName also has a machine name overload to check the processes on another machine.

Finally you can enumerate all processes on a machine by the GetProcesses method. The no-args method will enumerate the processes on the local computer. Otherwise provide the computer name in the overloaded version.

try
{
	Process[] allProcessesOnLocalMachine = Process.GetProcesses();
	foreach (Process process in allProcessesOnLocalMachine)
	{
		Console.WriteLine("Process name: {0}, ID: {1}", process.ProcessName, process.Id);
	}
}
catch (Exception ex)
{
	Console.WriteLine(ex.Message);
}

You can view all posts related to Diagnostics here.

Building a web service with Node.js in Visual Studio Part 3: MongoDb basics cont’d

Introduction

In the previous post we set up MongoDb and looked at the basics of querying against a MongoDb database. We also inserted a couple of customer objects with empty order arrays. Therefore we are familiar with the basics of insertions and querying in MongoDb.

In this post we’ll look at how to perform updates and deletions. Connect to the MongoDb through a command line like we saw in the previous post and get ready for some JavaScript.

Updates

Reference: modifying documents.

In case we’d like to update the name of a customer we can do it as follows using the $set operator:

db.customers.update({name: "Mickey Mouse"}, {$set: {name: "Pluto"}})

This will change the customer name “Mickey Mouse” to “Pluto”. If everything went fine then you’ll get a WriteResult statement in the command prompt with fields like nMatched: 1, nUpserted: 0, nModified: 1. You can probably guess that nMatched means the update operation found one matching documents. nModified means the number of documents modified. nUpserted is a mix of “updated” and “inserted”. An upsert is an update operation where a new document is inserted if there are no matching ones.

Read through the reference material above – it’s not long – and note the following:

  • An update operation will by default only update the first matching document – you can override this with the multi flag
  • By default no upsert will be performed in case the search doesn’t result in any document – you can override this with the upsert flag

Updating the orders array of a customer is very similar:

db.customers.update({name: "Great customer"}, {$set: {orders: [{"item": "Book",	"quantity": 2,	"itemPrice": 10  }, {"item": "Car",	"quantity": 1,	"itemPrice": 2000  }]}})

This will update the “orders” property of the customer whose name is “Great customer”. Note that this statement will update the customer’s orders and overwrite any existing orders array, much like the the UPDATE statement in SQL. How can we then insert a new item to an existing orders array? The $push operator comes to the rescue:

db.customers.update({name: "Great customer"}, {$push: {orders: {"item": "Pen",	"quantity": 5,	"itemPrice": 2  }}})

Deletions

Reference: removing documents.

To remove all customers with the name Pluto execute the following command:

db.customers.remove({name: "Pluto"})

The console output will show in a property called nRemoved how many matching documents were removed.

If you only want to remove the first matching document then indicate it in an index parameter:

db.customers.remove({name: "Mickey Mouse"}, 1)

What if you’d like to remove an item from the orders array? You cannot do that with the remove statement. After all it’s not really a deletion of a customer element but an update of a nested array. The $pull operator will perform what we’re after:

db.customers.update({name: "Great customer"}, {$pull: {orders: {item: "Pen"} } })

This will remove the first element in the orders array of “Great customer” whose item name is “Pen”. If you’d like to remove all array elements with item name “Pen” then use the multi flag:

db.customers.update({name: "Great customer"}, {$pull: {orders: {item: "Pen"} } }, {multi: true})

This should suffice for now. It’s good practice to test some queries based on the MongoDb reference manual. Most of it can be directly used in Node.js as we’ll see later.

In the next post we’ll discuss the basics of a Node.js application.

View all posts related to Node here.

An example of using ShellCommandActivity on Amazon Data Pipeline

Introduction

Amazon Data Pipeline helps you automate recurring tasks and data import/export in the AWS environment.

In this post we’ll go through a very specific example of using Data Pipeline: run an arbitrary JAR file from an EC2 instance through a bash script. This may not be something you do every single day but I really could have used an example when I went through this process in a recent project.

The scenario is the following:

  • You are working on a project within the Amazon web services environment
  • You have a compiled JAR file saved on S3
  • The JAR file can carry out ANY activity – it can range from printing “Hello world” to the console window to a complex application that interacts with databases and/or other Amazon components to perform some composite action
  • You’d like to execute this file automatically with logging and retries

In that case Data Pipeline is an option to consider. It has several so-called activity types, like CopyActivity, HiveActivity or RedShiftCopyActivity. I won’t go into any of these – I’m not sure how to use them and I’d like to concentrate on the solution to the problem outlined above.

Scripts

The activity type to pick in this case is ShellCommandActivity. It allows you to run a Linux bash script on an EC2 instance – or an Elastic MapReduce instance, but I didn’t see any use of that in my case. You’ll need at least 2 elements: the JAR file to be executed and a bash script which loads the JAR file onto the EC2 instance created by Data Pipeline and then executes it.

So say you have the following compiled Java application in S3:

JAR file in S3

The accompanying bash script is extremely simple but make sure you create it in a Linux-based editor or, if you want to edit the script in Windows, in a Windows-compatible bash script editor. Do not create the script in a Windows-based text editor like Notepad or Notepad++. The linefeed character won’t be properly recognised by the Linux EC2 instance trying to run the script. You may see some strange behaviour such as the JAR file is downloaded but then it cannot be located.

Create a bash script with the following 2 rows:

aws s3 cp s3://bucket-for-blog/SimpleModelJarForDataPipeline.jar /home/ec2-user/SimpleModelJarForDataPipeline.jar
java -jar /home/ec2-user/SimpleModelJarForDataPipeline.jar

The first line calls upon the Amazon CLI to copy a file located on S3 into the /home/ec2-user/ folder on the generated EC2 machine. Data Pipeline will access the new EC2 instance under the default “ec2-user” username, i.e. not admin which can lead to authorisation problems. E.g. if the ec2-user won’t be able to save the file to just any folder on the EC2 instance so it’s wise to select the default home directory of that user.

The second line then executes the JAR file with standard java -jar.

Save the script, upload it to S3 and take note of its URL, such as s3://scripts/taskrunner.sh

Setting up Data Pipeline

Then in the Data Pipeline console you can create a new pipeline as follows:

1. Click “Create new pipeline”: Create new pipeline button

2. Give it some name, description, a schedule and a bucket for the logs in the Create Pipeline window and click Create

3. A new screen will open where you can add Activities, data nodes and do some other stuff:

Create pipeline UI

You’ll see a panel on the right hand side of the screen with headers like Activities, DataNodes, Schedules etc.

4. Click the Add activity button. This will add a new activity with some default name like “DefaultActivity1” and the Activities section will open automatically.

5. Give the activity some name, select ShellCommandActivity as the type, the Schedule drop down should be populated with a name based on what type of schedule you created in the Create Pipeline window.

6. In the Add an optional field… drop-down select Script Uri and enter the S3 location of the bash script we created above.

7. In the Add an optional field… drop-down select Runs On. This will open a new drop-down list, select “Create new: Resource”. This will create a new Resource for you under the Resources tab although this is not visible for you at first. It will get the default name “DefaultResource1”.

8. Expand the Schedules tab and modify the schedule if necessary

9. Expand the Resources tab. Add the resource some name instead of “DefaultResource1”. This will automatically overwrite the resource name in the activity you created in step 7.

10. For the type select Ec2Resource. This will populate the Role and Resource Role drop down lists to DataPipelineDefaultRole and DataPipelineDefaultResourceRole. This means that the EC2 resource will execute the job with the rights defined for the DataPipelineDefaultResourceRole. We’ll come back to this a little later. You can leave these values as they are or change to a different role available among the drop-down values.

11. Add the following optional fields:

That’s it, click Save pipeline. DP will probably complain about some validation exceptions. Review them under Errors/Warnings. Example messages:

  • Insufficient permission to describe key pair
  • Insufficient permission to describe image id
  • resourceRole ‘…’ has insufficient permissions to run datapipeline due to…

This last message is followed by a long range of missing role types. Frankly, I don’t know why these messages appear and how to make them go away, but I simply chose to ignore them and the pipeline will still work.

Then click Save pipeline and you should be good to go. There will be stderr and stdout messages to review any messages and exceptions during the JAR file execution.

Before we finish here’s one tip regarding the DataPipelineDefaultResourceRole role. If your JAR file accesses other AWS resources, such as DynamoDb or S3, then it may fail. Review the stderr output after the job has been executed, you may see something similar:

IAM to be extended

You see that DataPipelineDefaultResourceRole has no rights to execute the ListClusters action on an Elastic MapReduce cluster. In this case you need to extend the permissions of the role in the IAM console. Click “Roles” on the left hand panel, select DataPipelineDefaultResourceRole and then click “Manage Policy”:

Manage role IAM

You’ll see a list of permissions as JSON. In the above case I would extend the JSON with the following:

“elasticmapreduce:ListClusters”

…i.e. exactly as it said in the exception message.

Depending on your exception you may need to add something else, like “dynamodb:Scan” or “cloudwatch:PutMetricData”.

View all posts related to Amazon Web Services here.

Reading and clearing a Windows Event Log with C# .NET

In this post we saw how to create a custom event log and here how to the write to the event log. We’ll briefly look at how to read the entries from an event log and how to clear them.

First let’s create an event log and put some messages to it:

string source = "DemoTestApplication";
string log = "DemoEventLog";
EventLog demoLog = new EventLog(log);
demoLog.Source = source;
demoLog.WriteEntry("First message", EventLogEntryType.Information, 101);
demoLog.WriteEntry("Hello!!", EventLogEntryType.Error, 980);
demoLog.WriteEntry("Bye", EventLogEntryType.Warning);
demoLog.WriteEntry("Long live Mondays", EventLogEntryType.Information, 200);
demoLog.WriteEntry("This is a demo", EventLogEntryType.Information, 250);

This is what it looks like in the Event Viewer:

Filling test event log

Reading from a log is also straightforward:

string log = "DemoEventLog";
EventLog demoLog = new EventLog(log);
EventLogEntryCollection entries = demoLog.Entries;
foreach (EventLogEntry entry in entries)
{
	Console.WriteLine("Level: {0}", entry.EntryType);
	Console.WriteLine("Event id: {0}", entry.InstanceId);
	Console.WriteLine("Message: {0}", entry.Message);
	Console.WriteLine("Source: {0}", entry.Source);
	Console.WriteLine("Date: {0}", entry.TimeGenerated);
	Console.WriteLine("--------------------------------");
}

…which gives the following output:

Reading from event log

Clearing a log is very easy:

demoLog.Clear();

…and the log entries are gone:

Cleared demo event log

You can view all posts related to Diagnostics here.

Default interface functions in Java 8

Introduction

A new feature in Java 8 is default function implementations. They are default implementations of methods of an interface. Default methods can help extending an interface without breaking the existing implementations. After all if you add a new method to an interface then all implementing types must handle it otherwise the compiler will complain.

This can be cumbersome if your interface has a large number of consumers. You’ll break their code and they will need to implement the new function – which they might not even need.

The default keyword for interfaces

In .NET the above problem can be easily solved by extension methods. There’s no equivalent of extension methods in Java – at least not that I know of – but it’s possible to approximate them using the ‘default’ keyword within an interface. Let’s say I have the following interface:

public interface ISomeInterface
{
    void doSomething();
    int countSomething();
    void shadyFunction();
}

Then an implementing class must include all of these otherwise you get a compiler error:

public class SomeImplementor implements ISomeInterface
{

    @Override
    public void doSomething()
    {
        System.out.println("Hello world");
    }

    @Override
    public int countSomething()
    {
        return 1000;
    }

    @Override
    public void shadyFunction()
    {
        System.out.println("Let's relocate to Mars");
    }
    
}

This is extremely basic, right? Now, what if you want to extend ISomeInterface without breaking SomeImplementor? Up until Java 7 this wan’t an option, but in Java 8 it’s possible as follows:

public interface ISomeInterface
{
    void doSomething();
    int countSomething();
    void shadyFunction();
    
    default void incredibleFunction(String message)
    {
        System.out.println(message);
    }
}

The compiler won’t complain that there’s no “incredibleFunction” implementation in SomeImplementor. You can still override it of course but you’re free to call the function from an instance of SomeImplementor:

SomeImplementor si = new SomeImplementor();
si.incredibleFunction("Fantastic!");

So the ‘default’ keyword in interfaces lets you provide a default implementation of a method without forcing the implementing classes to provide their own implementation. This is quite useful: you can extend an interface without worrying about the existing implementations.

We can see examples of default implementations throughout the new java.util.function interfaces. Predicate of T, i.e. a function that returns boolean and accepts one input parameter has an “and” default method which allows you to chain boolean operations that must be evaluated together:

Predicate<String> stringConditionOne = s -> s.length() > 20;
Predicate<String> stringConditionTwo = s -> s.contains("search");
        
Predicate<String> combinedPredicate = stringConditionOne.and(stringConditionTwo);

The default “and” implementation of the Predicate interface will simply test both conditions and return true if both evaluate to true.

The Predicate interface also has a default static “isEqual” method whose implementation simply calls the equals method of Object if the input parameter is not null:

Predicate<String> equal = Predicate.isEqual("hello");
boolean test = equal.test("hello");

Here “test” will be true.

View all posts related to Java here.

Building a web service with Node.js in Visual Studio Part 2: MongoDb basics

Introduction

In the previous post we outlined the goals of this series and discussed the basics of Node.js. In this post we’ll start from the very back of our service and set up the storage, namely the document-based MongoDb. There’s another series on this blog devoted to MongoDb in .NET. If you’ve never worked with MongoDb then I encourage you to read at least the first 2 parts in that series to get the overall idea. Make sure you understand the basic terminology of MongoDb, such as documents, BSON, collections and how objects are stored in documents.

For the sake of this demo we’ll look at JS and Json in MongoDb in some more detail. The series referred to above doesn’t look at interacting with the MongoDb database directly, only through the MongoDb C# driver which hides those details from us. E.g. it is possible to interact with an SQL Server database from a .NET application without writing a single line of SQL if you go through e.g. LINQ to Entities or LINQ to SQL. The details of opening and querying the database are abstracted away behind the database object context and LINQ statements.

This is, however, not the case with Node.js. There’s no LINQ to Node, or a Node.js driver for MongoDb or anything similar – not that I know of at least. We’ll later see a Node.js package which enables us to open the connection to MongoDb and send CRUD instructions to it but much of the syntax, especially in the case of filtering queries, will be the same as the bare-bones queries you send directly to MongoDb from the MongoDb console. So it is in fact some kind of Node.js driver for MongoDb but it doesn’t provide the same services as the C# driver in a .NET project. Therefore if you’re a staunch believer of relational databases and love using tools such as MS SQL management studio then you’ll need to take a deep breath and dive into the unknown 🙂 You’ll need to be familiar with a new query language designed for MongoDb. Don’t worry, the basics are not complex at all and there’s a lot of help on the MongoDb homepage and the language reference pages:

…and a whole lot more. These pages, especially the Reference manual will be good sources as you try to construct your queries.

This and the next post will be dedicated to MongoDb JavaScript and JSON syntax. This lays the foundations for the “real” stuff, i.e. when we interact with MongoDb through the web service interface. We’ll revisit many of these statements there.

Why MongoDb?

It is certainly possible to establish a connection to relational databases, like MS SQL or Oracle from Node.js but that’s not the norm. If a project already uses one of those and you need to build a Node.js module on top of it then you’ll need to work with it anyway. It’s, however, seldom the case that a brand new Node.js project will pick a relational database as its backup store. You’ll see that Node.js and document databases go hand in hand in practice. That is a more straightforward choice due to the extensive usage of JavaScript and JSON in Node.js and MongoDb. Also, it’s trivial to set up MongoDb on a database machine, you’re literally done in a couple of minutes. It is not the same hassle as setting up the more complex relational database applications like MS SQL. Also, Node.js is free and open-source, hence it’s more natural to pick a free and open-source database to accompany it.

Setup

Go through the first two pages in the MongoDb series referred to above. Make sure that you have MongoDb running as a service at the end of the process:

MongoDb running as a service

MongoDb CRUD operations

Connect to the MongoDb database by running mongo.exe in a command prompt. Make sure you navigate to the bin folder of the MongoDb installation folder. In my case this is c:\mongodb\bin:

MongoDb connecting to database

You’ll connect to the default “test” database upon the first connect. Note that connecting to a database doesn’t necessarily mean that the database exists – it won’t exist until you insert the first collection into it.

Type “show dbs” to list the databases. You’ll probably not see “test” among them. You can switch to another database with “use [database name]”, but again, the database won’t be created at first.

In the demo we’ll be working with customers and orders. In a relational database you’d probably create 2 or more tables to store customers and orders and order items and link them with secondary keys. Although you could solve it in a similar manner in a document database it’s better to think of collections as hierarchical representations of your objects. You store the customer and the orders in the same document, adhering to OOP principles.

Let’s look at an example. A customer and its orders can be represented in a JSON string as follows:

{
  "name": "Great customer",
  "orders": [{
	"item": "Book",
	"quantity": 2,
	"itemPrice": 10
  }, {
	"item": "Car",
	"quantity": 1,
	"itemPrice": 2000
  }]
}

Let’s first add “Great customer” to MongoDb. Switch to the customers context by running “use customers” in the MongoDb command prompt and then enter the following command:

db.customers.insert({name: "Great customer", orders: []})

If everything went OK then you’ll see something like “WriteResult…” and nInserted: 1 as a response.

Note that we inserted a new customer with an empty orders array. We will see this pattern later in the demo where we insert new customers through the web service. Another interesting detail is that you don’t need to put quotation marks around the property names: name vs. “name”, orders vs “orders” in the MongoDb JSON.

Let’s see if the object has really been inserted. Enter the following “find” command without parameters:

db.customers.find()

The “find” command with no parameters will select all elements from a collection. The output will be similar to the following:

{ "_id" : ObjectId("544cb61fda8014d9145c85e6"), "name" : "Great customer", "orders" : [ ] }

You’ll recognise “name” and “orders” but “_id” is new. If you haven’t specified an ID field then MongoDb will assign its own ID of type ObjectId to each new object with the property name “_id”. ObjectId is an internal type within MongoDb. You can specify an ID yourself but it’s your responsibility to make it unique, e.g.:

db.customers.insert({_id: 10, name: "Great customer", orders: []})

If there’s already an entry with id 10 then you’ll get an exception.

Let’s insert 2 more new customers:

db.customers.insert({name: "Donald Duck", orders: []})
db.customers.insert({name: "Mickey Mouse", orders: []})

Run the “find” command to make sure we have 3 customers in the customers collection.

You can search by customer name by adding a JSON-like query to the find method:

db.customers.find({name: "Donald Duck"})

Here’s the equivalent of the SQL “IN” clause to provide a range of values to the SELECT WHERE clause:

db.customers.find({name: { $in: ["Donald Duck", "Mickey Mouse"]}})

There’s a whole range of operators in MongoDb prefixed with the “$” character.

You can negate the statements using the $not operator:

db.customers.find({name: {$not: { $in: ["Donald Duck", "Mickey Mouse"]}}})

The above statement will return Great Customer, i.e. all customers whose name is not listed in the provided string array.

You can limit the returned fields by switching them on and off in a second JSON parameter. E.g. if you only wish to look at the ID of a customer then you can switch off “name” and “orders”:

db.customers.find({name: "Donald Duck"}, {name: 0, orders: 0})

We switch off “name” and “orders” by assigning 0 to them in the second JSON parameter. The _id field will be returned by default. If you’d like to view the orders only then enter the following command:

db.customers.find({name: "Donald Duck"}, {name: 0, _id: 0})

All fields that were NOT switched off by “0” in the selection parameter will be returned, in this case an empty array: “orders” : [].

The below query returns all customers who have not ordered anything yet, i.e. whose “orders” array is of size 0:

db.customers.find({orders: {$size: 0}})

If, however, you’d like to return all customers who have ordered at least 1 product, i.e. whose order array exceeds size 0 then you may test with the $gt, i.e. greater-than operator:

db.customers.find({orders: {$size: {$gt : 0}}})

…except that you’ll get an exception that $size is expecting a number. I’m not sure why this is the case and why it was implemented like this but the following statement with the $where operator will do the job:

db.customers.find({$where:"this.orders.length > 0"})

$where accepts a JavaScript command and we want to return items whose “orders.length” property is greater than 0. In fact the $size: 0 can be rewritten as follows:

db.customers.find({$where:"this.orders.length == 0"})

Note that this solution assumes that every element in the collection has an “orders” field. However, as you can store unstructured objects in a collection it’s not guaranteed that every customer will have an “orders” field. Say that in the beginning of the project you initialised each new customer like this:

db.customers.insert({name: "Donald Duck"})

In this case the above solution will throw an exception as “Donald Duck” has no “orders” field. To make sure this is not the case you can combine $where with $exists:

db.customers.find( {orders : {$exists:true}, $where:'this.orders.length>3'} )

We cannot go through all possible query examples here but this should be enough for starters. You can always consult the reference material mentioned in the introduction as you’re refining your queries. You can test your queries in the MongoDb command prompt like we did above to make sure they work as expected and to see how the result set is structured.

In the next post we’ll look at updates and deletions.

View all posts related to Node here.

Writing to the Windows Event Log with C# .NET

In this post we saw how to create and delete event logs. We’ve also seen a couple examples of writing to the event log. Here come some more examples.

Say you want to send a warning message to the System log:

string source = "DemoSourceWithinApplicationLogSystem";
EventLog systemEventLog = new EventLog("System");
if (!EventLog.SourceExists(source))
{
	EventLog.CreateEventSource(source, "System");
}
systemEventLog.Source = source;
systemEventLog.WriteEntry("This is warning from the demo app to the System log", EventLogEntryType.Warning, 150);

As there is no such source yet in any event log it must be registered first. In the CreateEventSource method you can specify which log the source will belong to. The WriteEntry method has 5 overloads, of which you can see one above with a message, an entry type and an event ID. The event ID is an arbitrary integer that you can specify. It is an optional parameter which is set to 0 by default. The warning occurs like this in the event viewer:

Writing a warning to the System log

Say you’d like to send a warning message to the Application log instead with no event ID:

string source = "DemoSourceWithinApplicationLog";
string log = "Application";
if (!EventLog.SourceExists(source))
{
	EventLog.CreateEventSource(source, log);
}
EventLog.WriteEntry(source, "This is a warning from the demo log", 
	EventLogEntryType.Warning);

Here it is:

Writing a warning to the application log

If you know that the source has already been registered then you can send a message in a shorter format:

string source = "DemoSourceWithinApplicationLog"
EventLog.WriteEntry(source, "This is an error messsage from the demo log", EventLogEntryType.Error, 100);

Error message in application log

You can view all posts related to Diagnostics here.

Creating and deleting event logs with C# .NET

The Windows event viewer contains a lot of useful information on what happens on the system:

Windows event viewer

Windows will by default write a lot of information here at differing levels: information, warning, failure, success and error. You can also write to the event log, create new logs and delete them if the code has the EventLogPermission permission. However, bear in mind that it’s quite resource intensive to write to the event logs. So don’t use it for general logging purposes to record what’s happening in your application. Use it to record major but infrequent events like shutdown, severe failure, start-up or any out-of-the-ordinary cases.

There are some predefined Windows logs in the event log: Application, Security and System are the usual examples. However, you can create your own custom log if you wish. The key is the EventLog object located in the System.Diagnostics namespace:

string source = "DemoTestApplication";
string log = "DemoEventLog";
EventLog demoLog = new EventLog(log);
demoLog.Source = source;
demoLog.WriteEntry("This is the first message to the log", EventLogEntryType.Information);

The new log type was saved under the Applications and Services log category:

First custom log

You’ll probably have to restart the Event Viewer to find the new log type.

You can write to one of the existing Windows logs as well by specifying the name of the log. So we can create a log source within the Application log as follows:

string source = "DemoSourceWithinApplicationLog";
string log = "Application";
if (!EventLog.SourceExists(source))
{
	EventLog.CreateEventSource(source, log);
}
EventLog.WriteEntry(source, "First message from the demo log within Application", EventLogEntryType.Information);

The log entry is visible within the Application log:

Log entry in the Application log

It’s very easy to delete your custom log:

string log = "DemoEventLog";
EventLog.Delete(log);

The log will be deleted. Again, you’ll have to restart the event viewer to see that changes.

You can view all posts related to Diagnostics here.

Elliot Balynn's Blog

A directory of wonderful thoughts

Software Engineering

Web development

Disparate Opinions

Various tidbits

chsakell's Blog

WEB APPLICATION DEVELOPMENT TUTORIALS WITH OPEN-SOURCE PROJECTS

Once Upon a Camayoc

ARCHIVED: Bite-size insight on Cyber Security for the not too technical.