Architecture of a Big Data messaging and aggregation system using Amazon Web Services part 2
December 7, 2014 3 Comments
Introduction
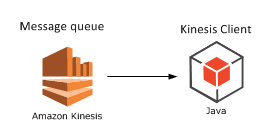
In the previous post of this series we outlined the system we’d like to build. We also decided to go for Amazon Kinesis as the message queue handler and that we’ll need an application which will consume messages from the Kinesis message stream.
In this post we’ll continue to build our design diagram and discuss where to store the raw data coming from Kinesis.
Storing the raw messages: Amazon S3
So now our Kinesis application, whether it’s Java, Python, .NET or anything else, is continuously receiving messages from the stream. It will probably perform all or some of the following tasks:
- Validate all incoming messages
- Filter out the invalid ones: they can be ignored completely or logged in a special way for visual inspection
- Perform some kind of sorting or grouping based on some message parameter: customer ID, UTC date or something similar
- Finally store the raw data in some data store
This “some data store” needs to provide fast, cheap, durable and scalable storage. We assume that the data store will need to handle a lot of constant write operations but read operations may not be as frequent. The raw data will be extracted later on during the analysis phase which occurs periodically, say every 15-30 minutes, but not all the time. Aggregating and analysing raw data every 15 minutes will suit many “real time” scenarios.
However, we might need to go in an find particular raw data points at a later stage. We possibly need to debug the system and check visually what the data points look like. Also, some aggregated data may look suspicious in some way so that we have to verify its consistency.
One possible solution that fits all these requirements is Amazon S3. It’s a blob storage where you can store any type of file in buckets: images, text, HTML pages, multimedia files, anything. All files are stored by a key which is typically the full file name.
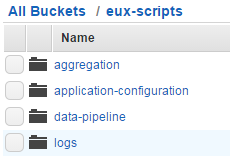
The files can be organised in buckets. Each bucket can have one or more subfolders which in turn can have their own subfolders and so on. Note that these folders are not the same type of folder you’d have on Windows but rather just a visual way to organise your files. Here’s an example where the top bucket is called “eux-scripts” which has 4 subfolders:
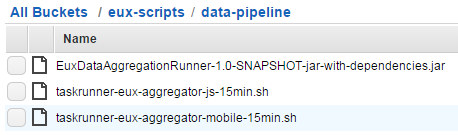
Here comes an example of .jar and .sh files stored in S3:
Keep in mind that S3 is not used for updates though. Once you’ve uploaded a file to S3 then it cannot be updated in a one-step operation. Even if you want to edit a text file there’s no editor for it. You’ll need to delete the old file and upload a new one instead.
Storing our raw data
So how can S3 be used to store our raw data? Suppose that we receive the raw data formatted as JSON:
{
    "CustomerId": "abc123",
    "DateUnixMs": 1416603010000,
    "Activity": "buy",
    "DurationMs": 43253
}
You can store the raw data in text files in S3 in the format you wish. The format will most likely depend on the mechanism that will eventually pull data from S3. Amazon data storage and analysis solutions such as RedShift or Elastic MapReduce (EMR) have been designed to read data from S3 efficiently – we’ll discuss both in this series. So at this stage you’ll need to do some forward thinking:
- A: What mechanism will need to read from the raw data store for aggregation?
- B: How can we easily – or relatively easily – read the raw data visually by just opening a raw data file?
For B you might want to store the raw data as it is, i.e. as JSON. E.g. you can have a text file in S3 called “raw-data-customer-abc123-2014-11-10.txt” with the following data points:
{"CustomerId": "abc123", "DateUnixMs": 1416603010000, "Activity": "buy", "DurationMs": 43253}
{"CustomerId": "abc123", "DateUnixMs": 1416603020000, "Activity": "buy", "DurationMs": 53253}
{"CustomerId": "abc123", "DateUnixMs": 1416603030000, "Activity": "buy", "DurationMs": 63253}
{"CustomerId": "abc123", "DateUnixMs": 1416603040000, "Activity": "buy", "DurationMs": 73253}
…i.e. with one data point per line.
However, this format is not suitable for point A above. Other mechanisms will have a hard time understanding this data format. For RedShift and EMR to work most efficiently we’ll need to store the raw data in some delimited fields such as CSV or tab delimited fields. So the above data points can then be stored as follows in a CSV file:
abc123,1416603010000,buy,43253
abc123,1416603020000,buy,53253
abc123,1416603030000,buy,63253
abc123,1416603040000,buy,73253
This is probably OK for point B above as well. It’s not too hard on your eyes to understand this data structure so we’ll settle for that.
File organisation refinements
We now know a little about S3 and have decided to go for a delimited storage format. The next question is how we actually organise our raw data files into buckets and folders. Again, we’ll need to consider points A and B above. In addition you’ll need to consider the frequency of your data aggregations: once a day, every hour, every quarter?
You might first go for a customer ID – or some other ID – based grouping, so e.g. you’ll have a top bucket and sub folders for each customer:
- Top bucket: “raw-data-points”
- Subfolder: “customer123”
- Subfolder: “customer456”
- Subfolder: “customer789”
- …etc.
…and within each subfolder you can have subfolders based on dates in the raw data points, e.g.:
- Sub-subfolder: “2014-10-11”
- Sub-subfolder: “2014-10-12”
- Sub-subfolder: “2014-10-13”
- Sub-subfolder: “2014-10-14”
- …etc.
That looks very nice and it probably satisfies question B above but not so much regarding question A. This structure is difficult to handle for an aggregation mechanism as you’ll need to provide complex search criteria for the aggregation. In addition, suppose you want to aggregate the data every 30 minutes and you dump all raw data points into one of those sub-subfolders. Then again you’ll need to set up difficult search criteria for the aggregation mechanism to extract just the correct raw data points.
One possible solution is the following:
- Decide on the minimum aggregation frequency you’d like to support in your system – let’s take 30 minutes for the sake of this discussion
- Have one dedicated top bucket like “raw-data-points” above
- Below this top bucket organise the data points into sub folders based on dates
The names of the date sub-folders can be based on the minimum aggregation frequency. You’ll basically put the files into intervals where the date parts are reversed according to the following format:
minute-hour-day-month-year
Examples:
- 00-13-15-11-2014: subfolder to hold the raw data for the interval 2014 November 15, 13:00:00 until 13:29:59 inclusive
- 30-13-15-11-2014: subfolder to hold the raw data for the interval 2014 November 15, 13:30:00 until 13:59:59 inclusive
- 00-14-15-11-2014: subfolder to hold the raw data for the interval 2014 November 15, 14:00:00 until 14:29:59 inclusive
…and so on. Each subfolder can then hold text files with the raw data points. In order to find a particular storage file of a customer you can do some pre-grouping in the Kinesis client application and not just save every data point one by one in S3: group the raw data points according to the customer ID and the date of the data point and save the raw files accordingly. You can then have the following text files in S3:
- abc123-2014-11-15-13-32-43.txt
- abc123-2014-11-15-13-32-44.txt
- abc123-2014-11-15-13-32-45.txt
…where the names follow this format:
customerId-year-month-day-hour-minute-second
So within each file you’ll have the CSV or tab delimited raw data that occurred in that given second. In case you want to go for a minute based pre-grouping then’ll end up with the following files:
- abc123-2014-11-15-13-31.txt
- abc123-2014-11-15-13-32.txt
- abc123-2014-11-15-13-33.txt
…and so on. This is the same format as above but at the level of minutes instead.
Keep in mind that all of the above can be customised based on your data structure. The main point is that S3 is an ideal way to store large amounts of raw data points within the Amazon infrastructure and that you’ll need to carefully think through how to organise your raw data point files so that they are easily handled by an aggregation mechanism.
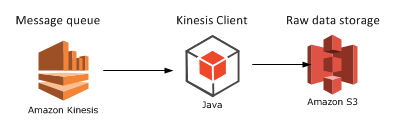
Finally let’s extend our diagram:
We’ll look at a potential aggregation mechanism in the next post: Elastic MapReduce.
View all posts related to Amazon Web Services here.