Finding all network adapters using WMI in C# .NET

In this post we saw how to retrieve all logical drives using Windows Management Intrumentation (WMI). We’ll follow a very similar technique to enumerate all network adapters.

The following code prints all non-null properties of all network drives found on the local – “root” – computer:

private static void ListAllNetworkAdapters()
{
	ManagementObjectSearcher networkAdapterSearcher = new ManagementObjectSearcher("root\\cimv2", "select * from Win32_NetworkAdapterConfiguration");
	ManagementObjectCollection objectCollection = networkAdapterSearcher.Get();

	Console.WriteLine("There are {0} network adapaters: ", objectCollection.Count);

	foreach (ManagementObject networkAdapter in objectCollection)
	{
		PropertyDataCollection networkAdapterProperties = networkAdapter.Properties;
		foreach (PropertyData networkAdapterProperty in networkAdapterProperties)
		{
			if (networkAdapterProperty.Value != null)
			{
				Console.WriteLine("Network adapter property name: {0}", networkAdapterProperty.Name);
				Console.WriteLine("Network adapter property value: {0}", networkAdapterProperty.Value);
			}
		}
		Console.WriteLine("---------------------------------------");
	}
}

Here’s an extract of the printout from my PC:

Network adapters extract console view

You can view all posts related to Diagnostics here.

Finding all WMI class properties with .NET C#

In this post we saw how to enumerate all WMI – Windows Management Intrumentation – namespaces and classes. Then in this post we saw an example of querying the system to retrieve all local drives:

ObjectQuery objectQuery = new ObjectQuery("SELECT Size, Name FROM Win32_LogicalDisk where DriveType=3");

The properties that we’re after are like “Size” and “Name” of Win32_LogicalDisk. There’s a straightforward solution as we can select all properties in the object query. The following method will print all properties available in the WMI class, their types and values:

private static void PrintPropertiesOfWmiClass(string namespaceName, string wmiClassName)
{
	ManagementPath managementPath = new ManagementPath();
	managementPath.Path = namespaceName;
	ManagementScope managementScope = new ManagementScope(managementPath);
	ObjectQuery objectQuery = new ObjectQuery("SELECT * FROM " + wmiClassName);
	ManagementObjectSearcher objectSearcher = new ManagementObjectSearcher(managementScope, objectQuery);
	ManagementObjectCollection objectCollection = objectSearcher.Get();
	foreach (ManagementObject managementObject in objectCollection)
	{
		PropertyDataCollection props = managementObject.Properties;
		foreach (PropertyData prop in props)
		{
			Console.WriteLine("Property name: {0}", prop.Name);
			Console.WriteLine("Property type: {0}", prop.Type);
			Console.WriteLine("Property value: {0}", prop.Value);
		}
	}
}

You’ll need to run this with VS as an administrator. Also, there’s no authentication so we’ll use this code to investigate the class properties on the local machine. Otherwise see the posts referred to above for an example to read WMI objects from another machine on your network.

Let’s see what’s there for us in the cimv2/Win32_LocalTime class:

PrintPropertiesOfWmiClass("root\\cimv2", "Win32_LocalTime");

I got the following output:

WMI class property name reader

Let’s see another one:

PrintPropertiesOfWmiClass("root\\cimv2", "Win32_BIOS");

Some interesting property values from the BIOS properties of my PC:

BIOS WMI properties

You can view all posts related to Diagnostics here.

Finding all WMI class names within a WMI namespace with .NET C#

In this post we saw an example of using WMI objects such as ConnectionOptions, ObjectQuery and ManagementObjectSearcher to enumerate all local drives on a computer. Recall the SQL-like query we used:

ObjectQuery objectQuery = new ObjectQuery("SELECT Size, Name FROM Win32_LogicalDisk where DriveType=3");

We’ll now see a technique to list all WMI classes within a WMI namespace. First we get hold of the WMI namespaces:

private static List<String> GetWmiNamespaces(string root)
{
	List<String> namespaces = new List<string>();
	try
	{
		ManagementClass nsClass = new ManagementClass(new ManagementScope(root), new ManagementPath("__namespace"), null);
		foreach (ManagementObject ns in nsClass.GetInstances())
		{
			string namespaceName = root + "\\" + ns["Name"].ToString();
			namespaces.Add(namespaceName);
			namespaces.AddRange(GetWmiNamespaces(namespaceName));
		}
	}
	catch (ManagementException me)
	{
		Console.WriteLine(me.Message);
	}

	return namespaces.OrderBy(s => s).ToList();
}

We call this method as follows to list all WMI namespaces on the local computer:

List<String> namespaces = GetWmiNamespaces("root");

The following method will retrieve all classes from a WMI namespace using the ManagementObjectSearcher object and a query:

private static List<String> GetClassNamesWithinWmiNamespace(string wmiNamespaceName)
{
	List<String> classes = new List<string>();
	ManagementObjectSearcher searcher = new ManagementObjectSearcher
				(new ManagementScope(wmiNamespaceName),
				new WqlObjectQuery("SELECT * FROM meta_class"));
	List<string> classNames = new List<string>();
	ManagementObjectCollection objectCollection = searcher.Get();
	foreach (ManagementClass wmiClass in objectCollection)
	{
		string stringified = wmiClass.ToString();
		string[] parts = stringified.Split(new char[] { ':' });
		classes.Add(parts[1]);
	}
	return classes.OrderBy(s => s).ToList();
}

The ManagementClass ToString method attaches the class name to the namespace with a colon hence the Split method.

You can then call this method for each namespace name:

foreach (String namespaceName in namespaces)
{
	List<String> classNames = GetClassNamesWithinWmiNamespace(namespaceName);
}

Listing all class names within all namespaces can take a lot of time though.

You can view all posts related to Diagnostics here.

Finding all local drives using WMI in C# .NET

WMI – Windows Management Instrumentation – provides a set of tools to monitor the system resources, such as devices and applications. WMI is represented by the System.Management library that you set a reference to in a .NET project.

We’ll quickly look at how to enumerate all local drives on a computer in your network. You might need to run Visual Studio as an administrator:

ConnectionOptions connectionOptions = new ConnectionOptions();
connectionOptions.Username = "andras.nemes";
connectionOptions.Password = "p@ssw0rd";
			
ManagementPath managementPath = new ManagementPath();
managementPath.Path = "\\\\machinename\\root\\cimv2";

ManagementScope managementScope = new ManagementScope(managementPath, connectionOptions);

ObjectQuery objectQuery = new ObjectQuery("SELECT Size, Name FROM Win32_LogicalDisk where DriveType=3");

ManagementObjectSearcher objectSearcher = new ManagementObjectSearcher(managementScope, objectQuery);
ManagementObjectCollection objectCollection = objectSearcher.Get();

foreach (ManagementObject managementObject in objectCollection)
{
	Console.WriteLine("Resource name: {0}", managementObject["Name"]);
	Console.WriteLine("Resource size: {0}", managementObject["Size"]);
}

First we set up the user information to access the other computer with the ConnectionOptions object. Then we declare the path to the WMI namespace where the resource exists. In this case it’s “root\\cimv2”.

Further down you’ll see how to list all WMI namespaces.

Next we build a ManagementScope object using the management path and connection options inputs. Then comes the interesting part: an SQL-like syntax to query the resource, in this case Win32_LogicalDisk. This page lists all selectable properties of Win32_LogicalDisk including the values for DriveType.

ManagementObjectSearcher is the vehicle to run the query on the declared scope. The Get() method of ManagementObjectSearcher enumerates all management objects that the query returned. The loop prints the properties that we extracted using the query.

Here’s how you can print the WMI namespaces of a root:

private static List<String> GetWmiNamespaces(string root)
{
	List<String> namespaces = new List<string>();
	try
	{
		ManagementClass nsClass = new ManagementClass(new ManagementScope(root), new ManagementPath("__namespace"), null);
		foreach (ManagementObject ns in nsClass.GetInstances())
		{
			string namespaceName = root + "\\" + ns["Name"].ToString();
			namespaces.Add(namespaceName);
			namespaces.AddRange(GetWmiNamespaces(namespaceName));
		}
	}
	catch (ManagementException me)
	{
		Console.WriteLine(me.Message);
	}

	return namespaces;
}

If you’d like to enumerate the WMI namespaces on your local PC then you can call this function like…

List<String> namespaces = GetWmiNamespaces("root");

You can view all posts related to Diagnostics here.

Creating a new performance counter on Windows with C# .NET

In this post we saw how to list all performance counter categories and the performance counters within each category available on Windows. The last time I checked there were a little more than 27500 counters and 148 categories available on my local PC. That’s quite a lot and will probably cover most diagnostic needs where performance counters are involved in a bottleneck investigation.

However, at times you might want to create your own performance counter. The System.Diagnostics library provides the necessary objects. Here’s how you can create a new performance counter category and a counter within that category:

string categoryName = "Football";
			
if (!PerformanceCounterCategory.Exists(categoryName))
{
	string firstCounterName = "Goals scored";
	string firstCounterHelp = "Goals scored live update";
	string categoryHelp = "Football related real time statistics";
				
	PerformanceCounterCategory customCategory = new PerformanceCounterCategory(categoryName);
	PerformanceCounterCategory.Create(categoryName, categoryHelp, PerformanceCounterCategoryType.SingleInstance, firstCounterName, firstCounterHelp);
}

You’ll need to run Visual Studio as an administrator to create the category and counter.

Don’t forget to check if the category exists otherwise you’ll get an exception. The new category and counter turns up in the Performance Monitor window:

Custom category and counter creation result

A slightly different way of creating a new counter is through the CounterCreationData object:

PerformanceCounterCategory customCategory = new PerformanceCounterCategory(categoryName);
CounterCreationData counterCreationData = new CounterCreationData(firstCounterName, firstCounterHelp, PerformanceCounterType.NumberOfItems32);
CounterCreationDataCollection collection = new CounterCreationDataCollection();
collection.Add(counterCreationData);
PerformanceCounterCategory.Create(categoryName, categoryHelp, collection);

If you add that counter to the Performance Monitor then there will be no data yet of course.

At first the counter will be set as read-only but it can be changed easily. The PerformanceCounter object has the Increment() and IncrementBy() methods. Increment() adds 1 to the counter value and IncrementBy() increments the value by the specified amount. You can pass a negative value to decrement the current counter value.

Let’s see these methods in action:

string categoryName = "Football";
string counterName = "Goals scored";
PerformanceCounter footballScoreCounter = new PerformanceCounter(categoryName, counterName);
footballScoreCounter.ReadOnly = false;
while (true)
{
	footballScoreCounter.Increment();
	Thread.Sleep(1000);
	Random random = new Random();
	int goals = random.Next(-5, 6);
	footballScoreCounter.IncrementBy(goals);
	Thread.Sleep(1000);
}

Performance Monitor starts putting the values in the graph:

Goals scored performance counter in Performance Monitor

You can view all posts related to Diagnostics here.

Reading the value of a performance counter on Windows with C# .NET

In this post we saw how to list all performance categories and the performance counters within each category. It’s equally straightforward to read the value of a performance counter. You’ll need at least the category and the name of the performance counter. If the counter is available in multiple instances then you’ll need to specify the instance name as well.

The following code will read the CPU usage and memory usage counters:

private static void ReadValuesOfPerformanceCounters()
{
	PerformanceCounter processorTimeCounter = new PerformanceCounter("Processor", "% Processor Time", "_Total");
	PerformanceCounter memoryUsage = new PerformanceCounter("Memory", "Available MBytes");			
	Console.WriteLine("CPU usage counter: ");
	Console.WriteLine("Category: {0}", processorTimeCounter.CategoryName);
	Console.WriteLine("Instance: {0}", processorTimeCounter.InstanceName);
	Console.WriteLine("Counter name: {0}", processorTimeCounter.CounterName);
	Console.WriteLine("Help text: {0}", processorTimeCounter.CounterHelp);
	Console.WriteLine("------------------------------");
	Console.WriteLine("Memory usage counter: ");
	Console.WriteLine("Category: {0}", memoryUsage.CategoryName);
	Console.WriteLine("Counter name: {0}", memoryUsage.CounterName);
	Console.WriteLine("Help text: {0}", memoryUsage.CounterHelp);
	Console.WriteLine("------------------------------");
	while (true)
	{
		Console.WriteLine("CPU value: {0}", processorTimeCounter.NextValue());
		Console.WriteLine("Memory value: {0}", memoryUsage.NextValue());
		Thread.Sleep(2000);
        }
}

Here’s an excerpt of the output:

Reading values of performance counters

You can view all posts related to Diagnostics here.

Listing all performance counters on Windows with C# .NET

Performance counters in Windows can help you with finding bottlenecks in your application. There’s a long range of built-in performance counters in Windows which you can view in the Performance Monitor window:

Performance Monitor window

Right-click anywhere on the larger screen to the right and select Add Counters to add your counters to the graph. The Add Counters window will show the categories first. You can then open a category and select one or more specific counters within that category. The graph will show the real-time data immediately:

Performance Monitor with added pre-built categories

The System.Diagnostics namespace has a couple of objects that let you find the available performance categories and counters on the local machine or on another machine. Each performance category has a name, a help text and a type. It’s straightforward to find the categories available on a machine:

PerformanceCounterCategory[] categories = PerformanceCounterCategory.GetCategories();
foreach (PerformanceCounterCategory category in categories)
{
	Console.WriteLine("Category name: {0}", category.CategoryName);
	Console.WriteLine("Category type: {0}", category.CategoryType);
	Console.WriteLine("Category help: {0}", category.CategoryHelp);
}

GetCategories() has an overload where you can specify a computer name if you’d like to view the counters on another computer within the network.

At the time of writing this post I had 161 categories on my machine. Example:

Name: WMI Objects
Help: Number of WMI High Performance provider returned by WMI Adapter
Type: SingleInstance

Once you got hold of a category you can easily list the counters within it. The below code prints the category name, type and help text along with any instance names. If there are separate instances within the category then we need to called the GetCounters method with the instance name if it exists otherwise we’ll get an exception saying that there are multiple instances.

PerformanceCounterCategory[] categories = PerformanceCounterCategory.GetCategories();
foreach (PerformanceCounterCategory category in categories)
{
	Console.WriteLine("Category name: {0}", category.CategoryName);
	Console.WriteLine("Category type: {0}", category.CategoryType);
	Console.WriteLine("Category help: {0}", category.CategoryHelp);
	string[] instances = category.GetInstanceNames();
	if (instances.Any())
	{
		foreach (string instance in instances)
		{
			if (category.InstanceExists(instance))
			{
				PerformanceCounter[] countersOfCategory = category.GetCounters(instance);
				foreach (PerformanceCounter pc in countersOfCategory)
				{
					Console.WriteLine("Category: {0}, instance: {1}, counter: {2}", pc.CategoryName, instance, pc.CounterName);
				}
			}
		}
	}
	else
	{
		PerformanceCounter[] countersOfCategory = category.GetCounters();
		foreach (PerformanceCounter pc in countersOfCategory)
		{
                	Console.WriteLine("Category: {0}, counter: {1}", pc.CategoryName, pc.CounterName);
		}
	}	
}

Each counter in turn has a name, a help text and a type. E.g. here’s a counter with the “Active Server Pages” category:

Name: Requests Failed Total
Help: The total number of requests failed due to errors, authorization failure, and rejections.
Type: NumberOfItems32

You can view all posts related to Diagnostics here.

4 ways to enumerate processes on Windows with C# .NET

A Process object in the System.Diagnostics namespace refers to an operating-system process. This object is the entry point into enumerating the processes currently running on the OS.

This is how you can find the currently active process:

Process current = Process.GetCurrentProcess();
Console.WriteLine(current);

…which will yield the name of the process running this short test code.

It’s probably very rare that you’ll use the above method for anything as it’s not too useful.

You can locate a Process by its ID as follows:

try
{
	Process processById = Process.GetProcessById(7436);
	Console.WriteLine(processById);
}
catch (ArgumentException ae)
{
	Console.WriteLine(ae.Message);
}

I opened the Windows Task Manager and took a process ID from the list. Process ID 7436 at the time of writing this post belonged to Chrome, hence the Console printed “chrome”. The GetProcessById throws an argument exception if there’s no Process with that id: “Process with an Id of 1 is not running”.

There’s an overload of GetProcessById where you can specify the name of the machine in your network where to look for the process.

You can also look for processes by their name:

Process[] chromes = Process.GetProcessesByName("chrome");
foreach (Process process in chromes)
{
	Console.WriteLine("Process name: {0}, ID: {1}", process.ProcessName, process.Id);				
}

I had 4 “chrome” processes running when writing this post with the following ids: 7544, 7436, 6620, 7996. GetProcessesByName also has a machine name overload to check the processes on another machine.

Finally you can enumerate all processes on a machine by the GetProcesses method. The no-args method will enumerate the processes on the local computer. Otherwise provide the computer name in the overloaded version.

try
{
	Process[] allProcessesOnLocalMachine = Process.GetProcesses();
	foreach (Process process in allProcessesOnLocalMachine)
	{
		Console.WriteLine("Process name: {0}, ID: {1}", process.ProcessName, process.Id);
	}
}
catch (Exception ex)
{
	Console.WriteLine(ex.Message);
}

You can view all posts related to Diagnostics here.

An example of using ShellCommandActivity on Amazon Data Pipeline

Introduction

Amazon Data Pipeline helps you automate recurring tasks and data import/export in the AWS environment.

In this post we’ll go through a very specific example of using Data Pipeline: run an arbitrary JAR file from an EC2 instance through a bash script. This may not be something you do every single day but I really could have used an example when I went through this process in a recent project.

The scenario is the following:

  • You are working on a project within the Amazon web services environment
  • You have a compiled JAR file saved on S3
  • The JAR file can carry out ANY activity – it can range from printing “Hello world” to the console window to a complex application that interacts with databases and/or other Amazon components to perform some composite action
  • You’d like to execute this file automatically with logging and retries

In that case Data Pipeline is an option to consider. It has several so-called activity types, like CopyActivity, HiveActivity or RedShiftCopyActivity. I won’t go into any of these – I’m not sure how to use them and I’d like to concentrate on the solution to the problem outlined above.

Scripts

The activity type to pick in this case is ShellCommandActivity. It allows you to run a Linux bash script on an EC2 instance – or an Elastic MapReduce instance, but I didn’t see any use of that in my case. You’ll need at least 2 elements: the JAR file to be executed and a bash script which loads the JAR file onto the EC2 instance created by Data Pipeline and then executes it.

So say you have the following compiled Java application in S3:

JAR file in S3

The accompanying bash script is extremely simple but make sure you create it in a Linux-based editor or, if you want to edit the script in Windows, in a Windows-compatible bash script editor. Do not create the script in a Windows-based text editor like Notepad or Notepad++. The linefeed character won’t be properly recognised by the Linux EC2 instance trying to run the script. You may see some strange behaviour such as the JAR file is downloaded but then it cannot be located.

Create a bash script with the following 2 rows:

aws s3 cp s3://bucket-for-blog/SimpleModelJarForDataPipeline.jar /home/ec2-user/SimpleModelJarForDataPipeline.jar
java -jar /home/ec2-user/SimpleModelJarForDataPipeline.jar

The first line calls upon the Amazon CLI to copy a file located on S3 into the /home/ec2-user/ folder on the generated EC2 machine. Data Pipeline will access the new EC2 instance under the default “ec2-user” username, i.e. not admin which can lead to authorisation problems. E.g. if the ec2-user won’t be able to save the file to just any folder on the EC2 instance so it’s wise to select the default home directory of that user.

The second line then executes the JAR file with standard java -jar.

Save the script, upload it to S3 and take note of its URL, such as s3://scripts/taskrunner.sh

Setting up Data Pipeline

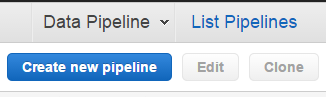
Then in the Data Pipeline console you can create a new pipeline as follows:

1. Click “Create new pipeline”: Create new pipeline button

2. Give it some name, description, a schedule and a bucket for the logs in the Create Pipeline window and click Create

3. A new screen will open where you can add Activities, data nodes and do some other stuff:

Create pipeline UI

You’ll see a panel on the right hand side of the screen with headers like Activities, DataNodes, Schedules etc.

4. Click the Add activity button. This will add a new activity with some default name like “DefaultActivity1” and the Activities section will open automatically.

5. Give the activity some name, select ShellCommandActivity as the type, the Schedule drop down should be populated with a name based on what type of schedule you created in the Create Pipeline window.

6. In the Add an optional field… drop-down select Script Uri and enter the S3 location of the bash script we created above.

7. In the Add an optional field… drop-down select Runs On. This will open a new drop-down list, select “Create new: Resource”. This will create a new Resource for you under the Resources tab although this is not visible for you at first. It will get the default name “DefaultResource1”.

8. Expand the Schedules tab and modify the schedule if necessary

9. Expand the Resources tab. Add the resource some name instead of “DefaultResource1”. This will automatically overwrite the resource name in the activity you created in step 7.

10. For the type select Ec2Resource. This will populate the Role and Resource Role drop down lists to DataPipelineDefaultRole and DataPipelineDefaultResourceRole. This means that the EC2 resource will execute the job with the rights defined for the DataPipelineDefaultResourceRole. We’ll come back to this a little later. You can leave these values as they are or change to a different role available among the drop-down values.

11. Add the following optional fields:

That’s it, click Save pipeline. DP will probably complain about some validation exceptions. Review them under Errors/Warnings. Example messages:

  • Insufficient permission to describe key pair
  • Insufficient permission to describe image id
  • resourceRole ‘…’ has insufficient permissions to run datapipeline due to…

This last message is followed by a long range of missing role types. Frankly, I don’t know why these messages appear and how to make them go away, but I simply chose to ignore them and the pipeline will still work.

Then click Save pipeline and you should be good to go. There will be stderr and stdout messages to review any messages and exceptions during the JAR file execution.

Before we finish here’s one tip regarding the DataPipelineDefaultResourceRole role. If your JAR file accesses other AWS resources, such as DynamoDb or S3, then it may fail. Review the stderr output after the job has been executed, you may see something similar:

IAM to be extended

You see that DataPipelineDefaultResourceRole has no rights to execute the ListClusters action on an Elastic MapReduce cluster. In this case you need to extend the permissions of the role in the IAM console. Click “Roles” on the left hand panel, select DataPipelineDefaultResourceRole and then click “Manage Policy”:

Manage role IAM

You’ll see a list of permissions as JSON. In the above case I would extend the JSON with the following:

“elasticmapreduce:ListClusters”

…i.e. exactly as it said in the exception message.

Depending on your exception you may need to add something else, like “dynamodb:Scan” or “cloudwatch:PutMetricData”.

View all posts related to Amazon Web Services here.

Reading and clearing a Windows Event Log with C# .NET

In this post we saw how to create a custom event log and here how to the write to the event log. We’ll briefly look at how to read the entries from an event log and how to clear them.

First let’s create an event log and put some messages to it:

string source = "DemoTestApplication";
string log = "DemoEventLog";
EventLog demoLog = new EventLog(log);
demoLog.Source = source;
demoLog.WriteEntry("First message", EventLogEntryType.Information, 101);
demoLog.WriteEntry("Hello!!", EventLogEntryType.Error, 980);
demoLog.WriteEntry("Bye", EventLogEntryType.Warning);
demoLog.WriteEntry("Long live Mondays", EventLogEntryType.Information, 200);
demoLog.WriteEntry("This is a demo", EventLogEntryType.Information, 250);

This is what it looks like in the Event Viewer:

Filling test event log

Reading from a log is also straightforward:

string log = "DemoEventLog";
EventLog demoLog = new EventLog(log);
EventLogEntryCollection entries = demoLog.Entries;
foreach (EventLogEntry entry in entries)
{
	Console.WriteLine("Level: {0}", entry.EntryType);
	Console.WriteLine("Event id: {0}", entry.InstanceId);
	Console.WriteLine("Message: {0}", entry.Message);
	Console.WriteLine("Source: {0}", entry.Source);
	Console.WriteLine("Date: {0}", entry.TimeGenerated);
	Console.WriteLine("--------------------------------");
}

…which gives the following output:

Reading from event log

Clearing a log is very easy:

demoLog.Clear();

…and the log entries are gone:

Cleared demo event log

You can view all posts related to Diagnostics here.

Elliot Balynn's Blog

A directory of wonderful thoughts

Software Engineering

Web development

Disparate Opinions

Various tidbits

chsakell's Blog

WEB APPLICATION DEVELOPMENT TUTORIALS WITH OPEN-SOURCE PROJECTS

Once Upon a Camayoc

ARCHIVED: Bite-size insight on Cyber Security for the not too technical.